
How to Calculate Drip Irrigation Flow Rate Before Buying Components
Calculate source capacity, row demand and total zone flow from the exact emitter or dripline option before choosing mainline, filters and pressure controls.
Published by IrriNex Store
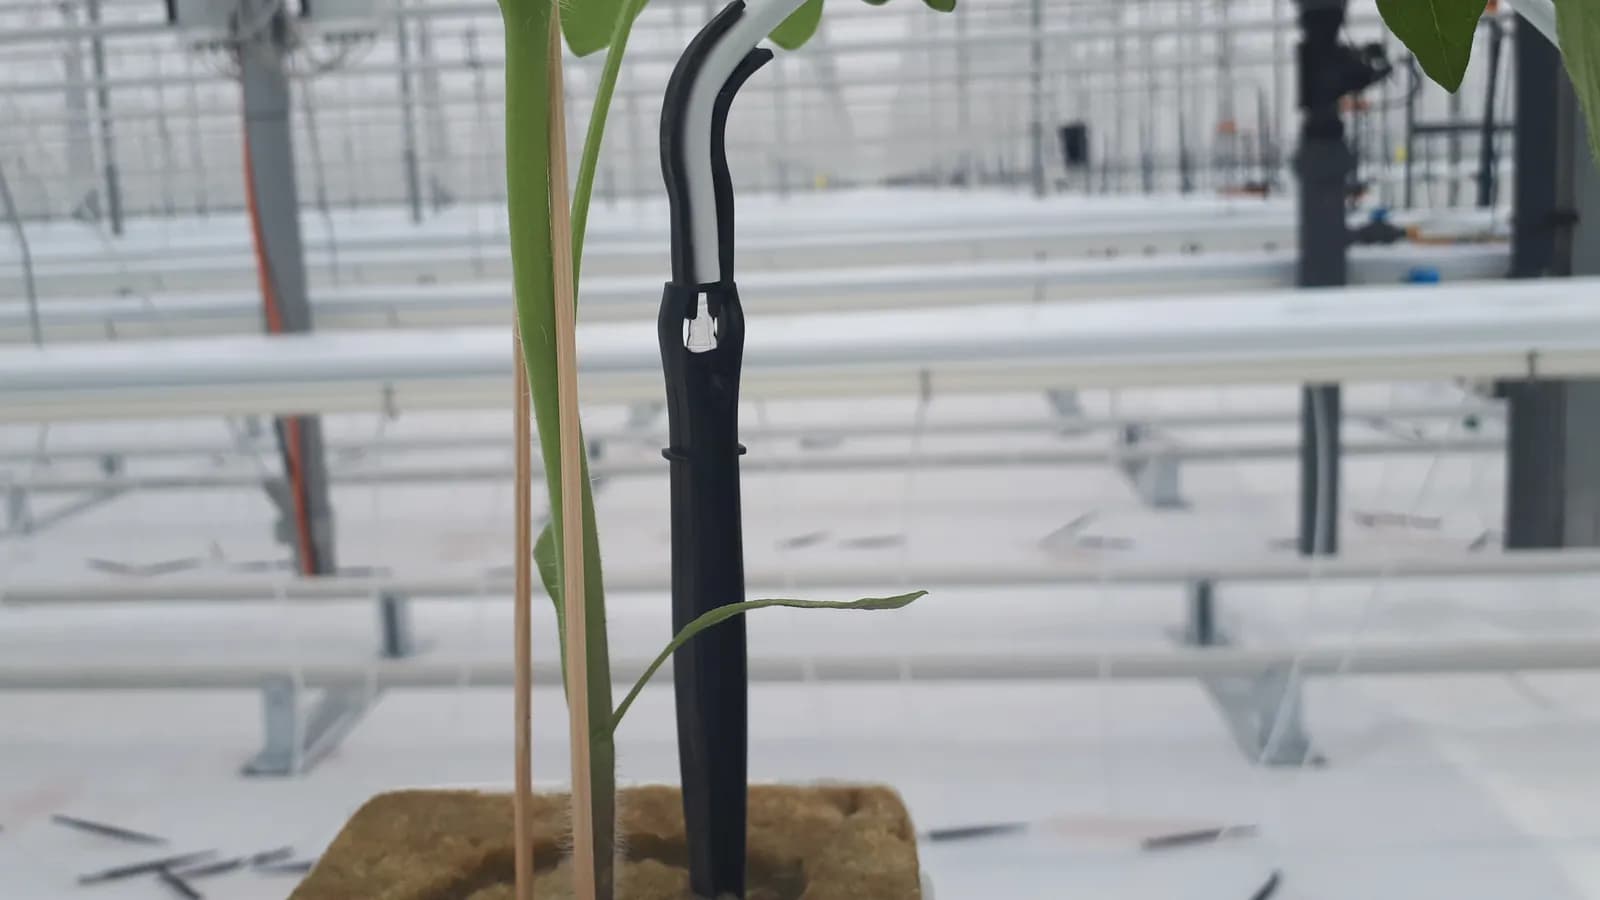
Drip irrigation flow rate is the volume of water that a source, zone, component or emitter passes during a stated time. A useful calculation keeps three values separate: measured source capacity, calculated zone demand and the rated flow range of each component. Mixing them can lead to starved emitters, an oversized filter, a regulator that will not operate or a mainline selected from guesswork. This guide calculates flow for point emitters, inline dripline and drip tape, converts common units, groups rows into zones and turns the result into a retail component checklist. Use the specifications of the exact product option and verify the finished zone under operating pressure.
Keep source capacity, demand and component rating separate
Source capacity is what the well, pump, tank or pressurised supply can deliver at a useful pressure. Zone demand is the sum of all outlets operating together. Component rating is the flow range or maximum that a filter, valve, regulator, pipe or injector can handle under stated conditions. These numbers are related but are not interchangeable.
A pump label may show its best flow at a low head, while the field needs more pressure. A filter may have a large connection but a lower useful flow at the chosen filtration grade. A line of emitters can have a calculated nominal demand, yet actual delivery changes with pressure, manufacturing tolerance and clogging. Write each value on a separate row with its source and unit.
Use the drip irrigation system design worksheet to map the hydraulic route. The calculation in this article supplies the flow column of that worksheet.
Measure source flow while the proposed drip zone is loaded
For a small source, collect water in a container with a verified volume and measure the fill time. Flow per minute equals container volume divided by minutes. If time is measured in seconds, litres per minute equal litres multiplied by 60 and divided by seconds. Repeat several times and use a representative result. A drip irrigation zone flow calculation should keep the measured supply case separate from the emitter total calculated for the proposed rows.
For a larger agricultural source, use a suitable flow meter or a verified pump test. Measure pressure at the same time. An unrestricted discharge can report more water than the source can provide after filters, elevation and pipe loss are included. Dynamic pressure identifies the actual operating condition.
Test during credible weak conditions: lower reservoir level, seasonal well drawdown or other authorised demand on a shared main. Record the date, valve arrangement and gauge position. Do not design to the absolute measured maximum. Keep an allowance for changing source conditions, filter loading and measurement uncertainty.
Standardise units before adding flows
Choose one working unit for the project. Litres per hour is convenient for small emitters; litres per minute or cubic metres per hour often suits a farm head unit. In imperial records, gallons per hour and gallons per minute must not be added directly.
- Litres per minute × 60 = litres per hour.
- Litres per hour ÷ 1,000 = cubic metres per hour.
- Gallons per minute × 60 = gallons per hour.
- For exact commercial work, confirm whether a source uses US gallons or imperial gallons before converting.
Keep enough decimal places during calculation, then round the final purchasing value sensibly. Premature rounding repeated across thousands of outlets can create a meaningful error. Store the original manufacturer unit beside the converted value.
Calculate point-emitter demand
For equal point emitters, the formula is simple: number of active emitters multiplied by rated flow per emitter. If 420 selected emitters are rated at 4 L/h each, nominal zone demand is 1,680 L/h, or 28 L/min. This is a design example, not a guarantee of actual discharge.
For mixed outputs, calculate each group and add the results. Two hundred 2 L/h outlets demand 400 L/h; 120 outlets rated at 4 L/h demand 480 L/h; the combined nominal flow is 880 L/h. Keep plant groups with different schedules in separate zones even when the source could supply the combined flow.
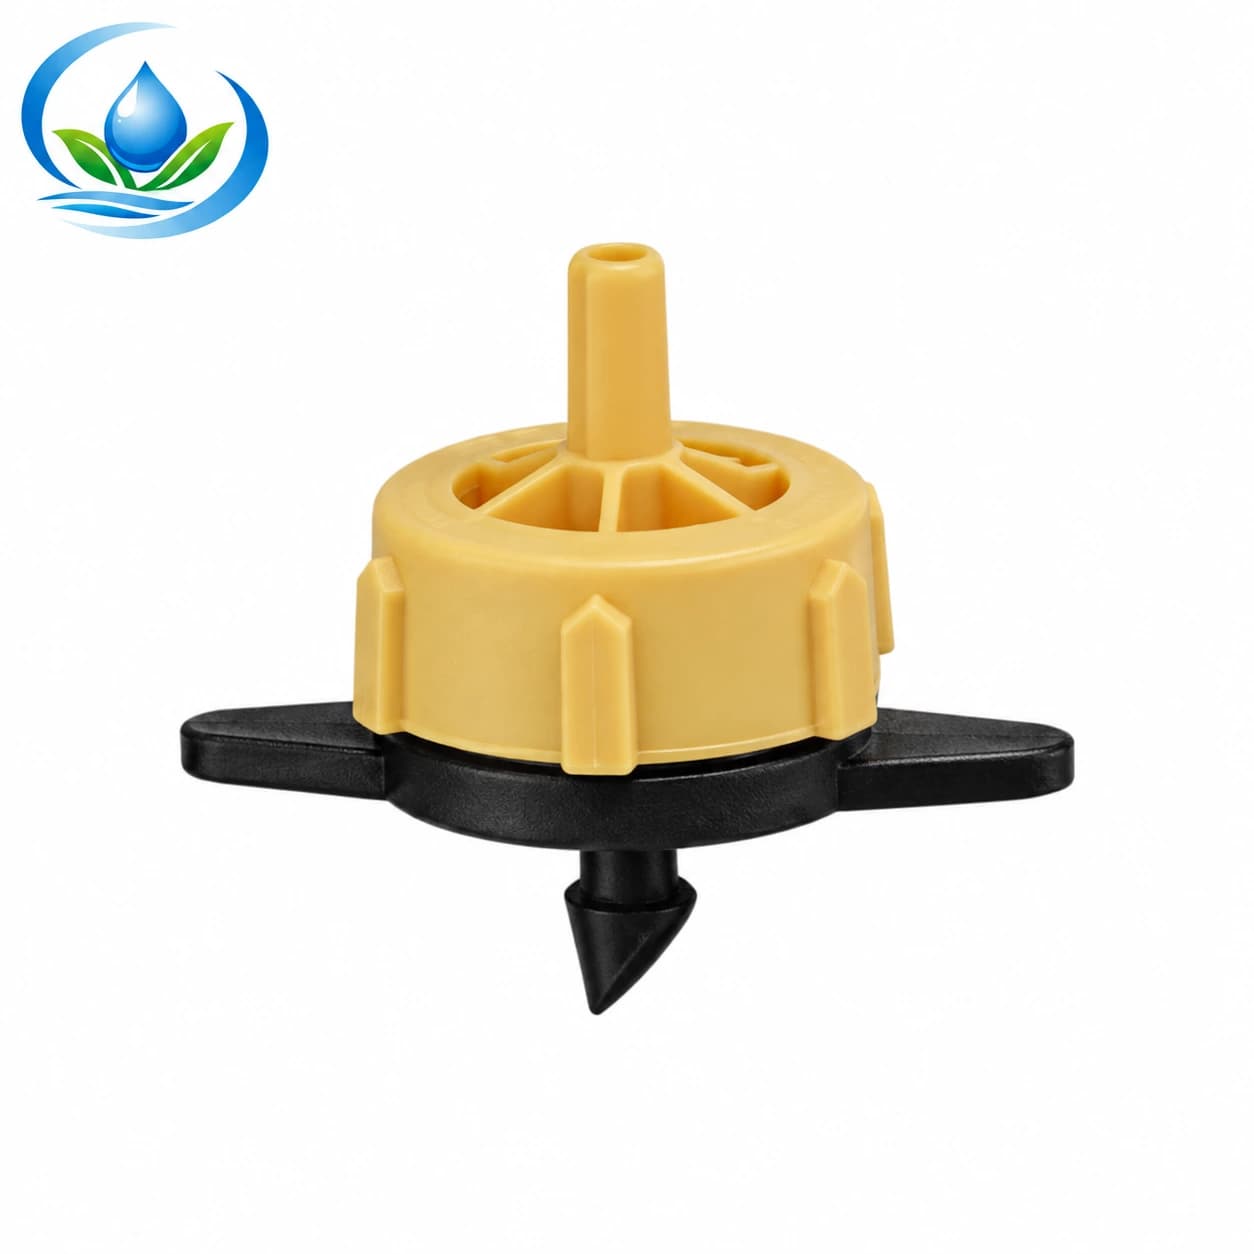
The pressure-compensating emitter family lists 2, 4 and 8 L/h options. Use the chosen option and quantity. Pressure compensation supports individual outlet stability within a specified range; it does not remove the need to calculate total demand or check pipe loss.
Calculate inline-dripline flow from outlet spacing and length
When each embedded outlet has a stated flow, first calculate the number of outlets. For evenly spaced emitters, outlet count is active length divided by spacing, with the endpoint convention checked against the manufacturer's layout. Then multiply by outlet flow and by the number of equal laterals.
Example: ten 75-metre laterals use 0.50-metre spacing. Each contains approximately 150 outlets. At a nominal 1.6 L/h per outlet, one lateral demands about 240 L/h and ten demand about 2,400 L/h, or 40 L/min. If a factory table directly states flow per 100 metres, use that supported value instead of reconstructing it from incomplete data.
On the 16 mm inline dripline page, emitter spacing and output are variant choices. Do not carry one option's calculation to another. Only the length open in the current zone contributes to simultaneous flow.
Calculate drip-tape flow from the published basis
Drip tape is commonly described by outlet flow, flow per unit length or flow for a standard roll section. Identify which basis the technical sheet uses. If flow is per outlet, use the spacing method. If it is per 100 metres, multiply by active length divided by 100. Never multiply both methods together.
Example: a tape option is documented at 500 L/h per 100 m under its stated test conditions. A 60 m row has a nominal flow of 300 L/h. Twelve rows operating together require 3,600 L/h. The real design must also respect pressure, maximum run guidance and the exact wall and emitter option.
Different spacing can change total flow even when the roll looks identical. Confirm diameter, wall thickness, outlet spacing, discharge basis and pressure. If the data sheet gives a range rather than one number, calculate the conservative operating case and request clarification.
Add branches and build a zone-flow schedule
A mixed zone is the sum of its simultaneously active branches. List each branch, product option, length or outlet count, unit flow and subtotal. Add only branches that truly run together. A valve that is normally closed belongs in another operating case.
| Branch | Quantity basis | Nominal subtotal | Operating case |
|---|---|---|---|
| Vegetable rows | 8 laterals × calculated flow per lateral | Enter exact result | Morning zone |
| Young trees | Emitter count × selected L/h | Enter exact result | Orchard zone |
| Flush flow | Measured or engineered requirement | Separate value | Maintenance only |
Create a minimum and maximum flow case when valves can change the active demand. This matters for regulators, injectors and meters that require a stated operating range. The zone schedule should show normal irrigation separately from flushing.
Use flow to decide where zones are needed
Compare calculated demand with the source capacity at the required dynamic pressure. If demand exceeds the dependable supply, reduce simultaneous rows. Even below the source maximum, zoning may be needed because pipe friction, elevation, crop schedule or component limits make one large group impractical.
Do not divide capacity by row demand and round upward. If the source supports 5.4 calculated rows, five is the mathematical ceiling before design allowance and pressure checks. Keep similar crop needs and lateral lengths together. Record how valves will prevent incompatible groups from opening at once.
The pressure-regulator guide explains why the smallest and largest zone flow both matter. A regulator or fertigation device can fail to operate when demand is below its minimum even if the maximum case is acceptable.
Translate zone flow into component checks
Once flow is known, screen every component in water-flow order. Check source protection, filter, flow meter, regulator, injector, valves, mainline, header and laterals. A nominal connection size does not prove adequate capacity. Compare rated flow, pressure loss and pressure class under the actual operating case.
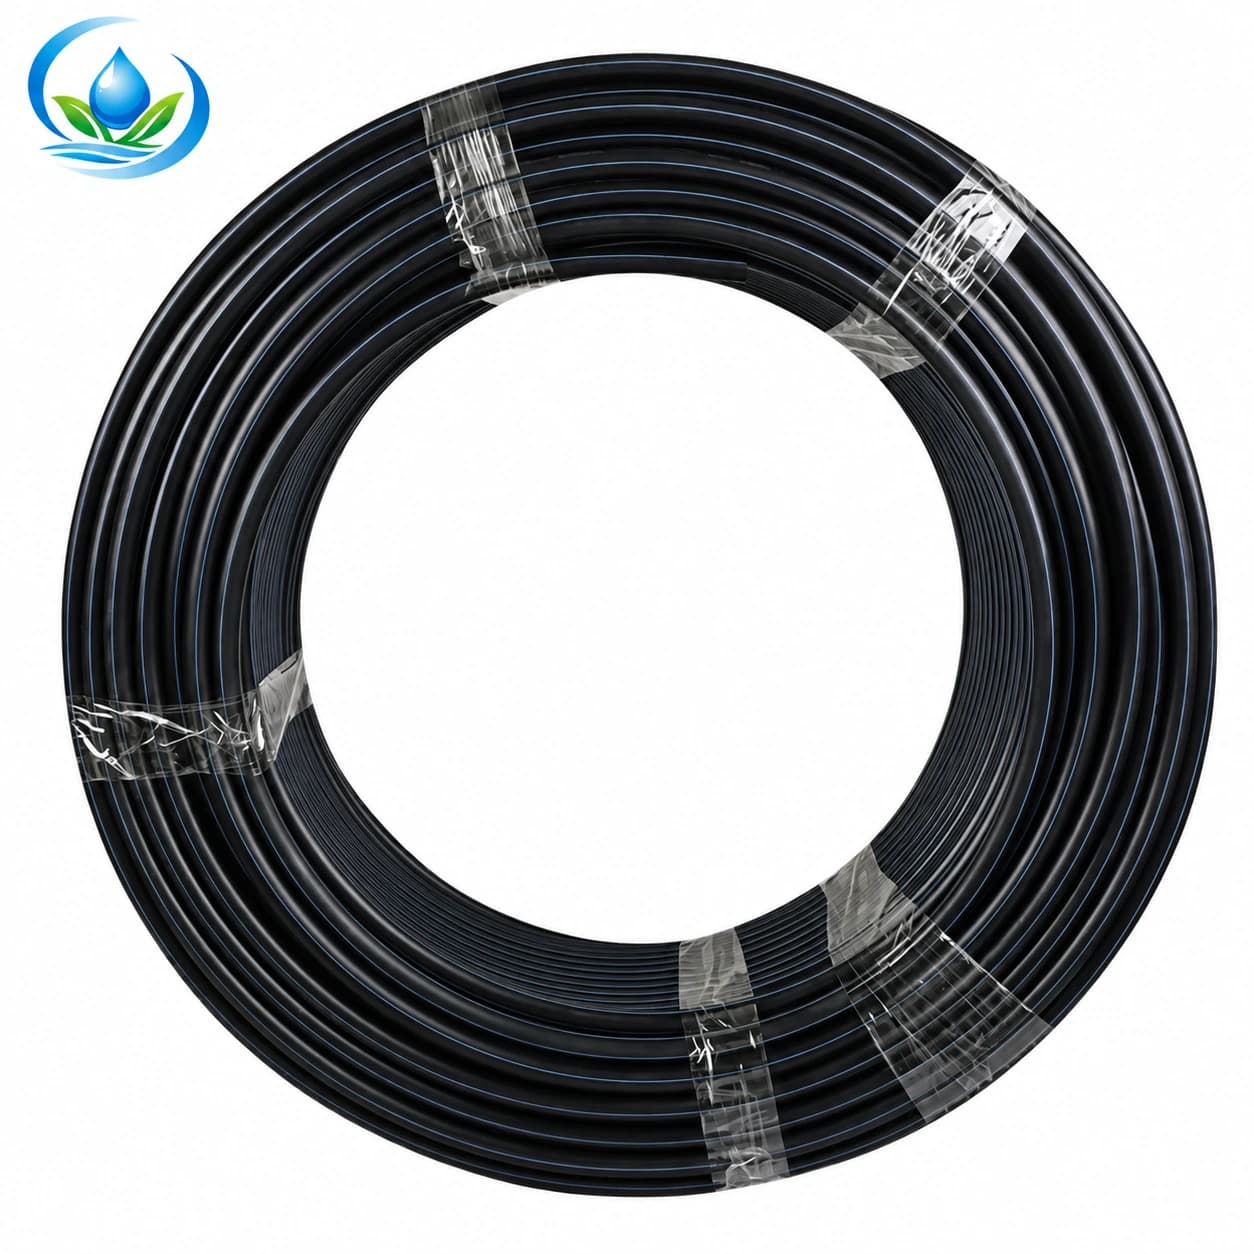
Mainline diameter requires a friction calculation using flow, internal diameter, length, fittings and elevation. Browse the PE mainline family for the available 32–160 mm options, then verify the exact pressure class and dimensions. Larger diameter generally reduces friction, but calculate the benefit before buying.
Filters must pass full zone flow at the required grade with manageable clean pressure loss and service interval. Regulators and fertilizer injectors need minimum and maximum flow checks. Valves and fittings should be evaluated by their internal passage and rating, not only the thread label.
Separate crop water volume from instantaneous flow
Daily crop requirement is a volume; zone flow is a rate. They connect through operating time. If a zone nominally applies 2,400 L/h and must deliver 7,200 litres, the arithmetic run time is three hours before considering distribution uniformity, soil intake, effective rainfall and management factors. Do not enlarge emitters merely to meet daily volume if soil cannot accept the faster application.
University of Minnesota Extension's specialty-crop irrigation guidance notes that closer tape-emitter spacing increases flow and pressure requirements, and that Venturi injector selection depends on irrigation-system flow. It also advises matching tape spacing, thickness and diameter to farm conditions.
Use agronomic scheduling to determine required volume and hydraulic calculation to determine how the system can deliver it. They belong in adjacent columns, not in one number.
Verify calculated flow after installation
Flush the new system, clean the filter and operate one zone at its design pressure. Read a calibrated meter at the head if available. Compare measured zone flow with the calculated total, allowing for documented emitter tolerance and measurement accuracy.
Collect equal-time samples from several outlets near, midway and far from the inlet. Multiply a representative measured outlet rate by count only after checking that distribution is reasonably uniform. A correct head-meter total can hide a leak and clogged outlets that offset one another.
Investigate a large difference. Higher flow may come from excessive pressure, leaks, more active branches or the wrong emitter option. Lower flow may indicate inadequate pressure, clogged filtration, closed valves, kinked pipe, fewer active outlets or incorrect product data. Update the worksheet with the verified baseline.
Use a pre-order calculation checklist
- Measure source flow and pressure together under a representative load.
- Select the exact emitter, dripline or tape variant.
- Convert all outlet values to one flow unit.
- Calculate each row or branch, then the simultaneous zone total.
- Create minimum, normal, maximum and flushing cases where relevant.
- Compare every filter, regulator, valve and injector with those cases.
- Size delivery pipe from hydraulic loss, not connection size alone.
- Commission the zone and retain measured flow and pressure.
Use the agricultural component shopping list after calculation. If a product basis is unclear, send the selected variant, active length, outlet count, source test and worksheet through IrriNex Store support.
Frequently asked flow questions
Is flow rate the same as pressure?
No. Flow is volume per time; pressure is the energy driving it. Measure both at the intended operating condition.
Should every roll metre be included?
Only include the length operating simultaneously. Spare roll and closed zones do not add to current demand.
Can rated emitter flow be treated as measured flow?
Use it for design at the stated test pressure, then verify the installed zone. Actual delivery reflects pressure, tolerance, clogging and installation.
How much spare source capacity is enough?
There is no universal percentage. Allow for source variation, filter loading, measurement uncertainty and future use only when that use is defined.
Why calculate minimum flow?
Regulators, meters and injectors may require a minimum flow to work. A device sized only for the maximum zone can behave poorly on a small sub-zone.
Calculate once, verify, and keep the record
A dependable flow schedule starts with a loaded source test, uses exact variant data, adds only simultaneous outlets and keeps units consistent. It then checks each component and zone against minimum and maximum cases. The calculation is complete only after field measurements support it.
Keep the worksheet with the order and maintenance log. It will help identify whether a later change comes from the source, a dirty filter, altered zoning, leakage or emitter condition. It also turns future purchasing into a specification comparison instead of a guess based on pipe appearance.
Before you order
Compare this guide with the specifications for your exact product, selected option, water supply and field conditions. Your equipment requirements take priority over a general example.
Compare irrigation products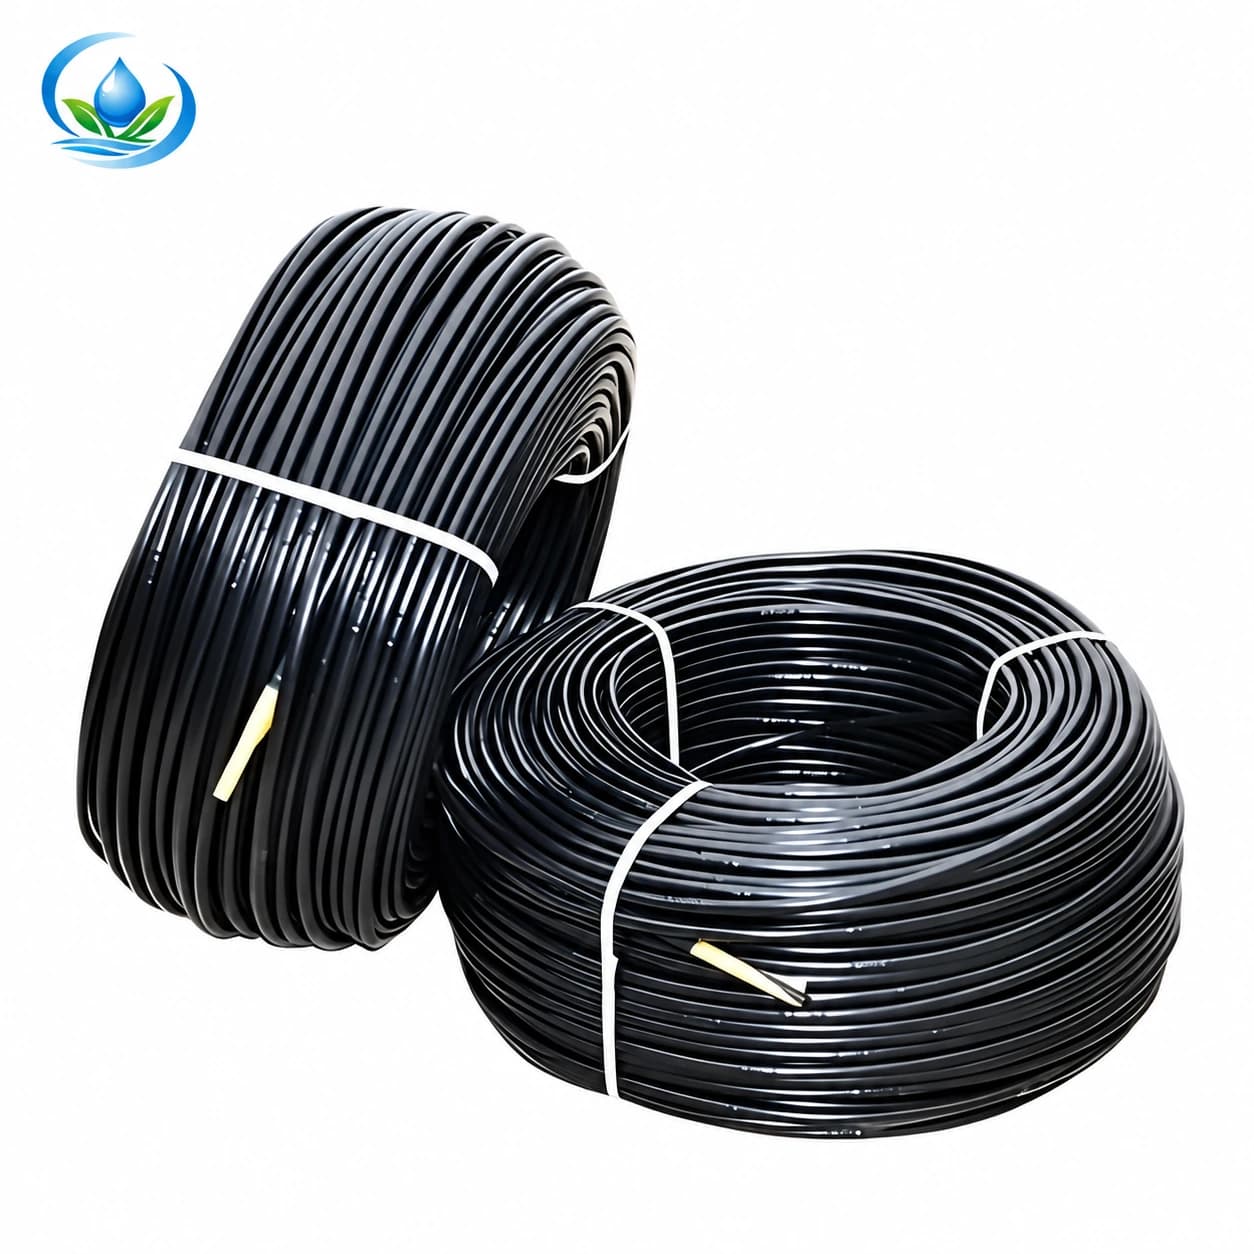
.jpg)